Introduction
Overpressure (also called overload pressure), proof pressure, and burst pressure are important specifications for pressure sensors and systems. They represent different levels of pressure that a sensor or system can withstand. Let’s examine each one in detail and discuss their relationships:
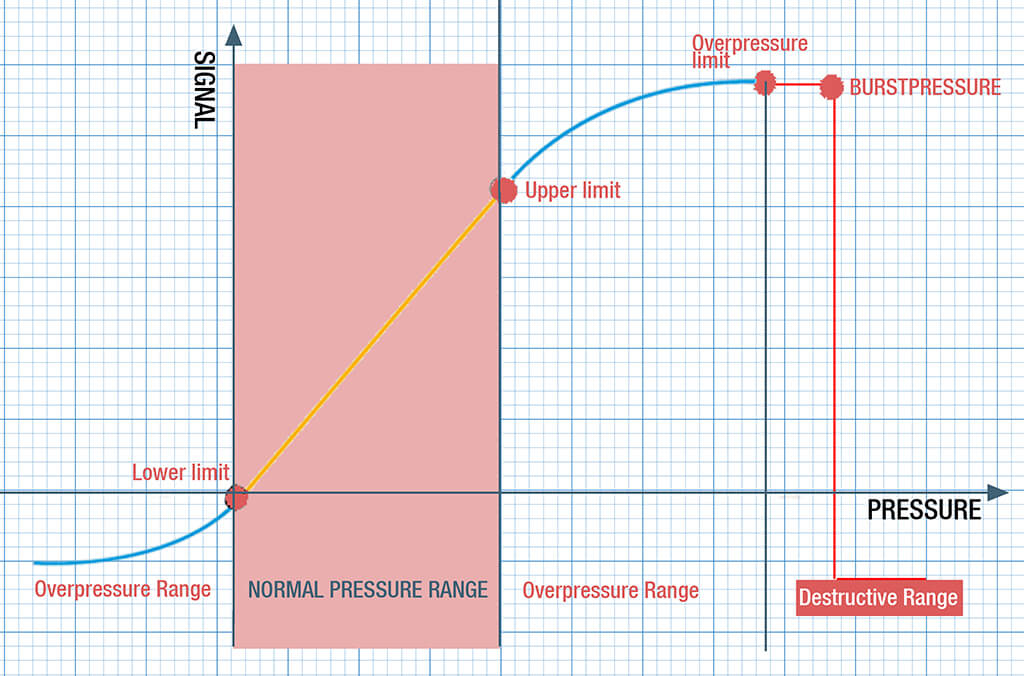
Overpressure
The maximum pressure that can be applied to the sensor without causing a shift in performance or calibration.
Overpressure is the highest pressure a pressure sensor can handle without affecting its performance. It also refers to cases where the pressure goes beyond the set limits. While it’s not the best situation, pressure transducers can tolerate occasional pressures up to their overpressure rating and will return to normal afterward.
Characteristics of overpressure including:
- Temporary and reversible
- Does not cause permanent damage
- Sensor returns to normal operation when pressure is reduced
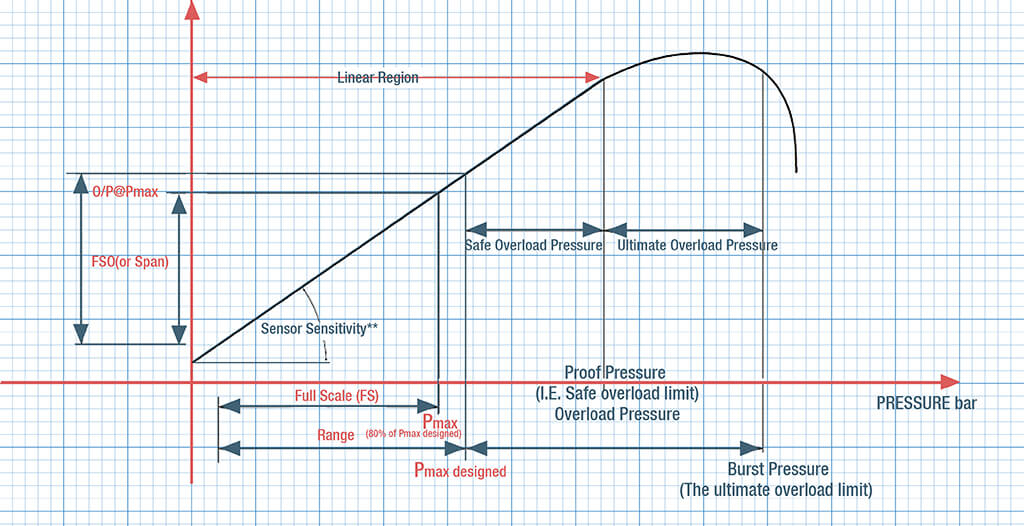
- Typically: 1.5 to 2 times the full-scale pressure range
Proof Pressure
Proof pressure is the maximum pressure that a pressure sensor can withstand without experiencing permanent damage or a significant shift in its performance characteristics. It’s typically higher than the normal operating pressure range but lower than the burst pressure.
Characteristics of proof pressure including:
- May cause temporary changes in calibration
- No permanent physical damage occurs
- Sensor may require recalibration after exposure
- Typically: 1.5 to 3 times the full scale pressure range
Burst Pressure
Burst pressure for a pressure sensor is a critical specification that defines the maximum pressure the sensor can withstand before catastrophic failure occurs.
Burst pressure for a pressure sensor is a critical specification that defines the maximum pressure the sensor can withstand before catastrophic failure occurs.
Burst pressure tests are usually destructive and performed on sample units, not on every sensor produced.
Unlike proof pressure events, there is no expectation of the sensor returning to normal operation after experiencing burst pressure.
Characteristics of burst pressure including:
- Causes permanent and irreversible damage
- Sensor is destroyed and cannot be used again
- Often determined through destructive testing
- Typically: 3 to 5 times the full-scale pressure range (or higher)
Overpressure Duration Time & Repetition
Let’s explore how overpressure and duration, repetition can affect sensor accuracy using a below example. We’ll consider a piezoresistive pressure sensor with the following specifications:
Background
Sensor Specifications:
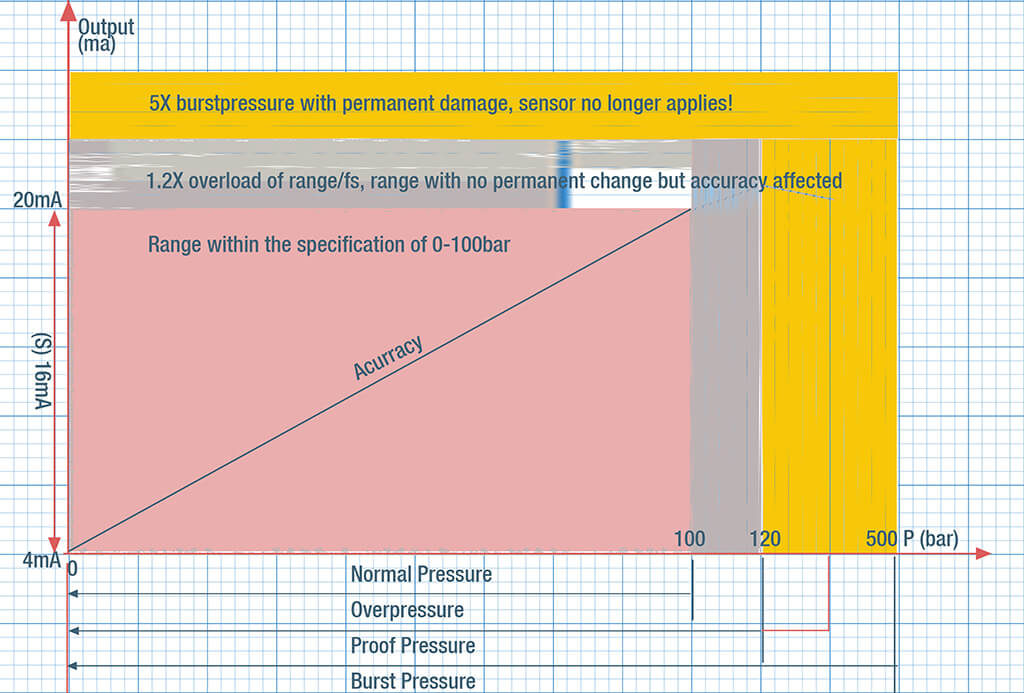
- Measurement Range: 0-100 bar
- Rated Overpressure: 150 bar
- Initial Accuracy: ±25% Full Scale (FS)
- Output: 4-20 mA
Initial Calibration:
- 0 bar = 4.00 mA
- 50 bar = 12.00 mA
- 100 bar = 20.00 mA
3 scenarios and their performances
Let’s examine three scenarios with varying overpressure durations and repetitions:
- Scenario 1: Short Duration, Single Occurrence, Overpressure: 140 bar for 1 second, once
- Scenario 2: Extended Duration, Single Occurrence, Overpressure: 140 bar for 1 hour, once
- Scenario 3: Short Duration, Multiple Occurrences, Overpressure: 140 bar for 1 second, repeated 100 times over a week
| Output signal (mA) | Output signal (mA) | Output signal (mA) | |
| Pressure (bar) | 【1】140 bar for 1 second | 【2】140 bar for 1 hour | 【3】140 bar for 1s, repeated 100 times |
| 0 | 4.02 | 4.08 | 4.15 |
| 50 | 12.01 | 12.05 | 12.10 |
| 100 | 20.03 | 20.10 | 20.18 |
Analysis: how we understand it?
Duration Effect
- Short duration (Scenario 1) caused minimal accuracy degradation.
- Extended duration (Scenario 2) led to more significant zero shift and span error.
Repetition Effect
- Multiple exposures (Scenario 3) resulted in cumulative damage, causing the most severe accuracy degradation.
- Repeated stress likely caused material fatigue in the sensing element.
- Increased with both duration and repetition.
- Most pronounced in Scenario 3, indicating potential permanent deformation.
- Generally less affected than zero shift.
- Increased with duration and repetition, but not as drastically as zero shift.
- Minimal impact in short-duration scenarios.
- Became noticeable with repeated exposures (Scenario 3).
- Degraded from initial ±25% FS to:
- Scenario 1: ±3% FS
- Scenario 2: ±55% FS
- Scenario 3: ±1% FS
| Zero shift | Span error | Overall accuracy | |
|---|---|---|---|
| Scenario 1 | 0.125%/FS | 0.0625% FS | ±0.3% FS |
| Scenario 2 | 0.5% FS | 0.125% F | ±0.55% FS |
| Scenario 3 | 0.9375% FS | 0.1875% FS | ±1% FS |
This example demonstrates that both the duration and frequency of overpressure events play crucial roles in sensor accuracy degradation. While sensors are designed to withstand some overpressure, repeated or prolonged exposure can lead to cumulative damage and significant accuracy issues.
Take an example to show the relationships
Background:
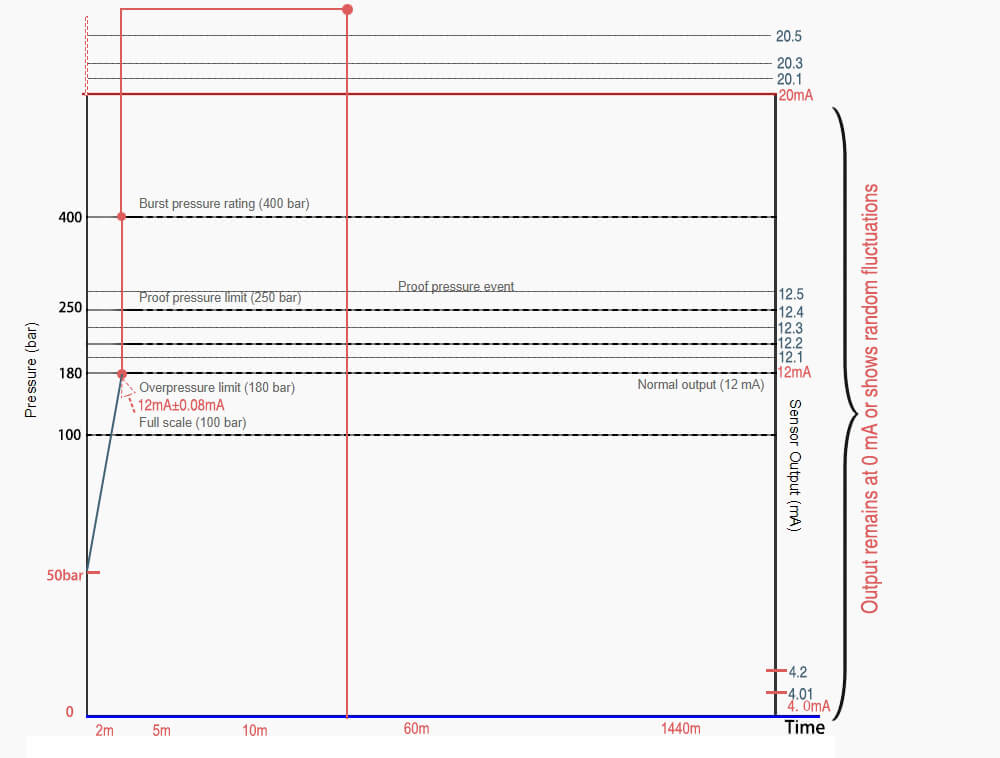
- Measurement range: 0-100 bar
- Overpressure rating: 180 bar (1.8 times full scale)
- Proof pressure rating: 250 bar (2.5 times full scale)
- Burst pressure rating: 400 bar (4 times full scale)
- Accuracy: ±5% Full Scale (FS)
- Output: 4-20 mA
Overpressure Event
1. Normal operation: At 50 bar, sensor outputs 12 mA (±0.08 mA)
2. Overpressure event: Sensor exposed to 170 bar for 1 minute
3. During overpressure: Output exceeds 20 mA and accuracy not guaranteed
4. After pressure returns to 50 bar:
- Immediate reading: 12.1 mA (slight offset)
- After 5 minutes: 12.02 mA (nearly normal)
- After 15 minutes: 12 mA (within original accuracy)
- Subsequent performance:
- 0 bar: 4.01 mA (minimal zero shift)
- 100 bar: 20.02 mA (minimal span change)
- Linearity and hysteresis within specs
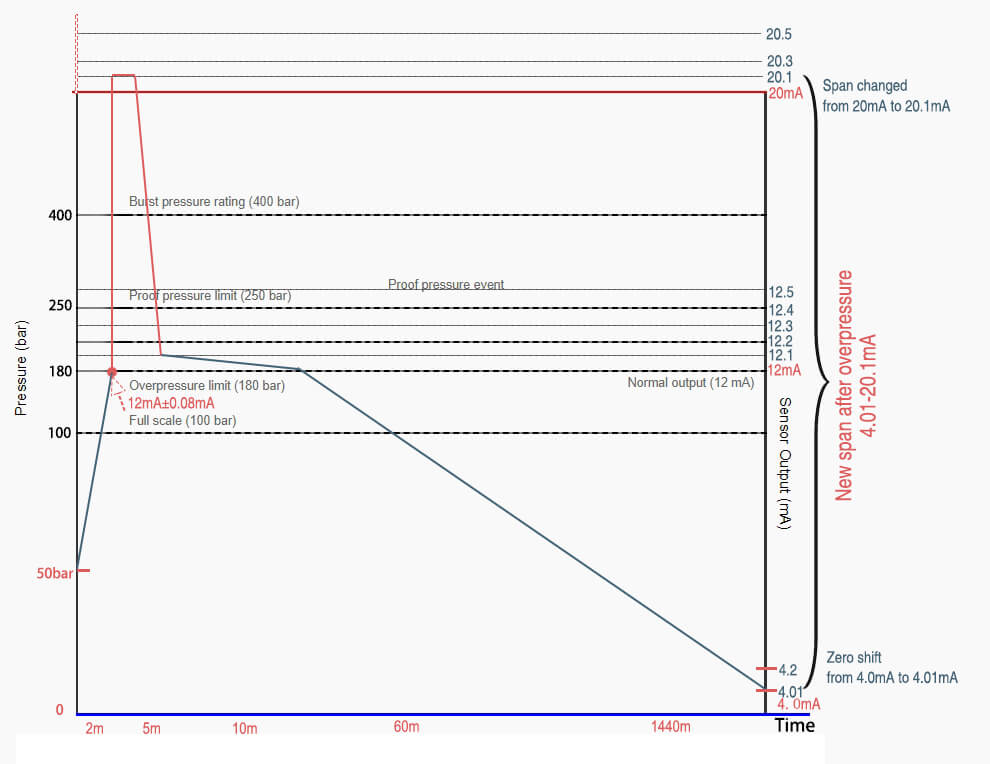
Proof Pressure Event
1. Normal operation: At 50 bar, sensor outputs 12 mA (±0.08 mA)
2. Proof pressure event: Sensor exposed to 240 bar for 10 minutes
3. During proof pressure: Output significantly exceeds 20 mA, and accuracy not guaranteed
4. After pressure returns to 50 bar:
- Immediate reading: 12.4 mA (significant offset)
- After 1 hour: 12.3 mA (still notable shift)
- After 24 hours: 12.2 mA (improved, but outside original accuracy)
- Subsequent performance:
- 0 bar: 4.2 mA (noticeable zero shift)
- 100 bar: 20.4 mA (span change)
- Linearity slightly affected
- Recalibration process:
- Zero adjustment: -0.2 mA
- Span adjustment: -0.4 mA
- After recalibration, sensor returns to original accuracy

Burst Pressure Event
1. Normal operation: At 50 bar, sensor outputs 12 mA (±0.08 mA)
2. Burst pressure event: Sensor exposed to 380 bar
3. During burst pressure: Output becomes erratic and unpredictable and sensing element physically ruptures
4. After pressure is removed:
- Sensor output remains at 0 mA or shows random fluctuations
- Physical inspection reveals damaged diaphragm or cracked housing
5. Subsequent attempts at operation:
- Sensor fails to respond to pressure changes
- No meaningful output can be obtained
Key differences: what we find
1. Reversibility: Overpressure effects are quickly reversible, proof pressure effects require recalibration, burst pressure causes irreversible damage.
2. Operational status: After overpressure and proof pressure, the sensor can still function (though may need recalibration). After burst pressure, the sensor is permanently non-functional.
3. Pressure magnitude: Each scenario involves progressively higher pressures, demonstrating different aspects of the sensor’s pressure endurance.
4. Recovery process: Overpressure requires no intervention, proof pressure requires recalibration, burst pressure requires complete sensor replacement.
This comprehensive example illustrates the distinct characteristics and impacts of overpressure, proof pressure, and burst pressure on a pressure sensor.